The “pandas.rolling().mean()” Trap
Here’s the RSI every junior engineer ships in their first PR:
delta = df['close'].diff()
gain = delta.clip(lower=0)
loss = -delta.clip(lower=0)
avg_gain = gain.rolling(14).mean()
avg_loss = loss.rolling(14).mean()
rs = avg_gain / avg_loss
rsi = 100 - 100 / (1 + rs)
It compiles. It runs on a static CSV in a notebook. The plot looks like an RSI oscillator — bounded, noisy, crossing 70 and 30 at plausible-looking moments. It gets merged.
It is wrong, and it is wrong in two ways that only surface in production.
First, it isn’t the RSI anyone else is trading against. J. Welles Wilder’s original 1978 definition doesn’t use a simple rolling mean of the last 14 gains and losses. It uses an exponentially weighted recursion — avg_gain = (avg_gain_prev * (period - 1) + gain) / period — seeded once by a simple average and then smoothed forever after with alpha = 1/period. That recursion incorporates every prior gain and loss in the session, geometrically decayed, not just the trailing 14 bars. A rolling(14).mean() throws away everything outside the window. On a real price series these two statistics diverge hard: our test suite runs both side by side on the same 500-tick series and finds material disagreement (>0.5 RSI points) on more than half of all bars once the recursion has had room to depart from the shared seed. Your dashboard says OVERBOUGHT. Your broker’s dashboard — running the real Wilder recursion — says neutral. You size a position against a signal nobody else is looking at.
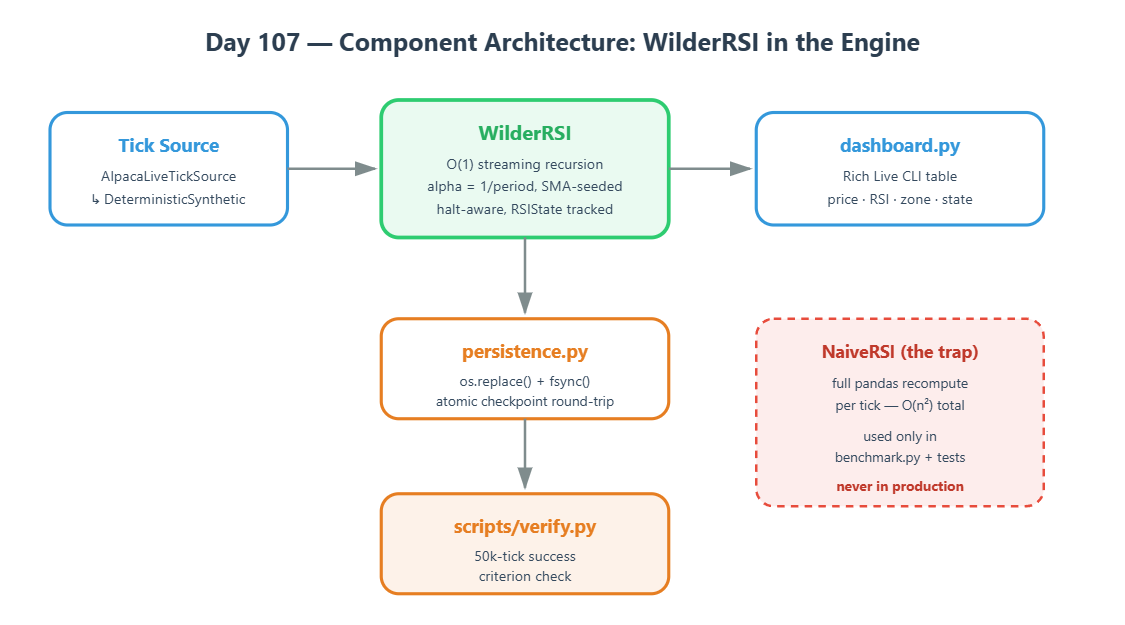
Second, the naive implementation doesn’t scale. The version above looks fine because it’s called once on a DataFrame that already contains the whole session. The moment you wire it into a live event loop — append the new tick, recompute .diff() and .rolling().mean() over the entire accumulated history, take the last value, repeat on the next tick — you’ve built an O(n) operation that runs on every tick of a growing session. That’s O(n²) over the life of the session. It’s invisible in a 500-row backtest. In our benchmark it costs a ~2,100x slowdown at just 500 ticks and keeps growing: recomputing over the full history takes 0.65s at 500 ticks and 3.95s at 4,000 ticks, while the streaming recursion stays flat at ~0.001–0.002s regardless of history length. Run that on a live tick stream during a volatility spike — exactly when your strategy most needs to react — and you block the event loop while the market moves without you.
The Failure Mode
Two distinct crashes hide in the naive version, and they’re easy to miss individually:
Divergence, not a crash. The naive RSI never throws an exception. It returns a plausible-looking number that is simply wrong relative to the market consensus. This is the more dangerous failure — a
ZeroDivisionErrorgets a support ticket; a silently wrong signal gets your strategy filled at the wrong price with no error in the logs.The division-by-zero everyone forgets.
RS = avg_gain / avg_lossis undefined the instant a strictly-increasing run drivesavg_lossto exactly zero — which happens constantly in low-volatility instruments and in any sufficiently long uptrend. Most reference implementations you’ll find on Stack Overflow don’t guard this at all. Ours has to:WilderRSI.valuetreatsavg_loss == 0as a saturation case (RSI clamps to 100 on a strict uptrend, or 50 if the price hasn’t moved at all), never an exception.
The AutoQuant-Alpha Architecture