Day 63 — Performance Audit: Verifying P&L Math After Frictions

The “Sum-The-Fills” Trap
Every junior engineer eventually writes the same P&L function. It looks something like this:
pnl = 0.0
for fill in fills:
    pnl += (fill.exit_price - fill.entry_price) * fill.qty
It compiles. It runs. On a ten-trade backtest it even produces a number that looks plausible. So it ships. Three weeks later, after 40,000 paper fills have streamed through the book, the dashboard says the strategy is up $1,212.0000000000002 and the reconciliation job against the broker statement is off by four cents that nobody can explain. The engineer spends a night assuming it’s a logic bug in the strategy. It isn’t. It’s
float.This is the trap: P&L accounting is treated as an afterthought bolted onto the strategy loop, computed in the same numeric type used for indicator math, and never independently re-derived from the raw fill ledger. The strategy “looks” correct because nobody is auditing it against ground truth — they’re trusting the running total the strategy object kept in memory.
The Failure Mode
Two independent failures compound here, and conflating them is what kills accounts:
1. Floating-point drift. IEEE-754 doubles cannot represent most decimal fractions exactly. 0.1 + 0.2 != 0.3 in Python, and that error doesn’t cancel — it accumulates monotonically across tens of thousands of additions. Over a single session this is cosmetic. Over a quarter of live trading, compounded with reinvested P&L, drift of even 1e-9 per trade becomes a four-figure reconciliation break, and your risk system is now sizing positions off a number that has quietly diverged from reality.
2. Friction blindness. The naive loop above prices fills at fill.entry_price / fill.exit_price — it assumes the strategy got exactly the price it asked for. It didn’t. Every market order crossed the spread. Every fill paid a commission and, on US equities, an SEC/FINRA pass-through fee on the sell side. None of that is in the strategy’s signal logic, so none of it is in the strategy’s self-reported P&L. The strategy thinks it’s profitable. The broker statement says otherwise. By the time you notice, you’ve sized your next ten trades off a Sharpe ratio that was never real.
The two failures are different in kind — one is a numeric representation bug, the other is a missing model — but they present identically: “my dashboard number doesn’t match my broker statement,” which is why most teams misdiagnose one as the other and waste a day.
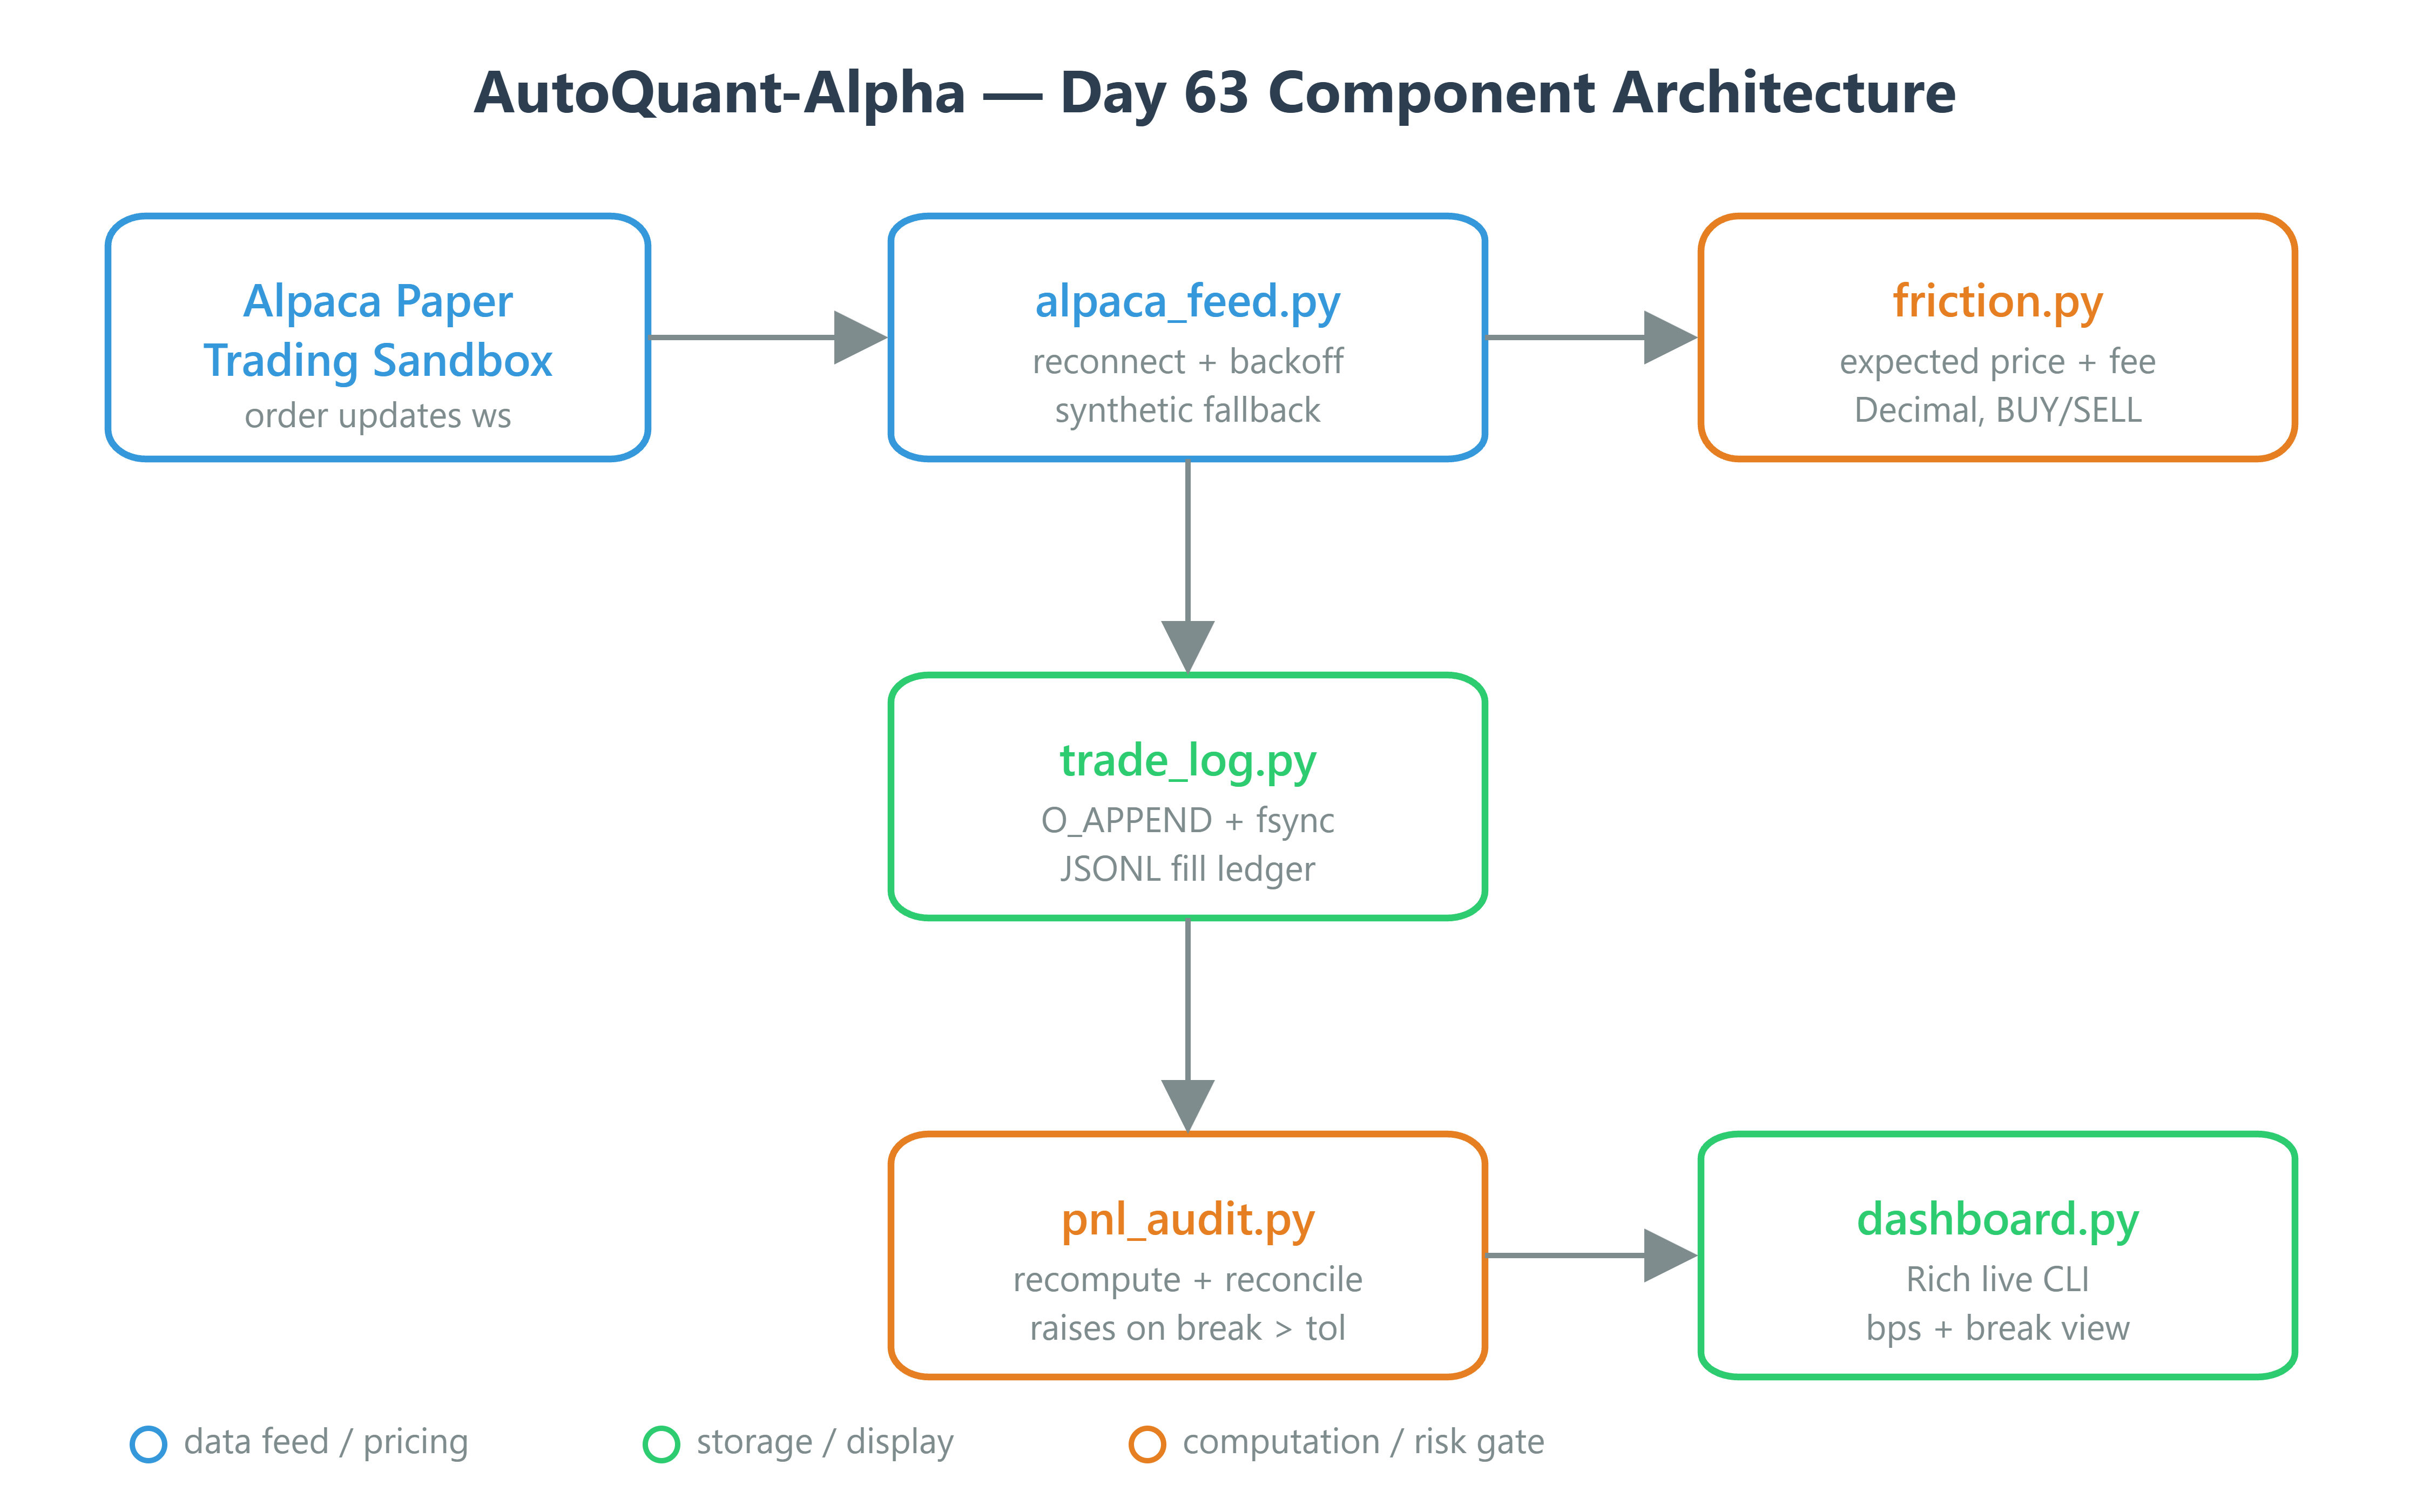
The AutoQuant-Alpha Architecture
We separate signal P&L (what the strategy intended to capture) from realized P&L (what the account actually holds), and we reconcile the two as a first-class, scheduled job — not an emergency script you write the night something looks wrong.
Three components, each with one job:
FrictionModel— a pure function of(side, quantity, quoted_bid, quoted_ask, venue_fee_bps)that returns the expected fill price and cost, before any order is sent. This is your pre-trade estimate.TradeLedger— an append-only, crash-safe log of actual fills as reported back by the broker (Alpaca’s paper trading API), recorded inDecimal, neverfloat.PnLAuditor— reads the ledger, independently recomputes realized P&L from raw fills using exact decimal arithmetic, compares it against the strategy’s self-reported figure, and raises if the divergence exceeds a tolerance — in basis points, not dollars, so it scales with position size.