Day 73 — Win Rate: The Metric Everyone Miscalculates First

The df[df.pnl > 0].count() / len(df) Trap
Here’s how a junior engineer ships win rate on day one: load the trade journal into a DataFrame, filter for pnl > 0, divide by the total row count, multiply by 100, ship it. Four lines, correct on the sample data, wrong in production in two specific ways that only show up once real fills start arriving.
First, it’s an O(n) rescan bootstrapped onto a live system. If win rate is exposed on a dashboard that refreshes every few seconds — which it should be, because win rate degrading mid-session is exactly the kind of signal that should pull an operator’s attention — that filter-and-count runs against the entire historical journal on every tick. At 200 trades this is invisible. At 50,000 trades (roughly six weeks of a 1,500-trade-per-day intraday strategy) it’s a multi-millisecond stall on every refresh, competing with whatever thread is also trying to log the next fill. You built a real-time monitor that gets slower the longer the strategy runs, which is backwards: the metric matters most exactly when the journal is largest.
Second — and this is the one that actually costs money — pnl > 0 treats every trade with a positive P&L as a “win,” including the ones that closed at +$0.03 after a $0.30 round-trip commission ate 90% of the edge. A strategy that’s flat on average but pays commission on every fill will show a suspiciously high win rate (most trades close marginally positive before fees, marginally negative after) while quietly losing money. The naive win rate isn’t lying exactly, but it’s answering a question nobody asked: “what fraction of trades had pnl_cents >= 1“ is not the same question as “is this strategy’s edge real.” An operator watching that number gets false confidence at the exact moment they should be pulling the strategy.
The Failure Mode, Precisely
Two independent bugs compound here. The performance bug is the O(n) rescan — pandas boolean filtering plus a .count() is vectorized and fast per call, but “fast per call, called on every tick against an ever-growing frame” is still an unbounded cost curve. The correctness bug is the missing scratch band: floating-point or unadjusted-integer P&L comparisons against a bare > 0 boundary classify commission noise as skill. Combine them and you get a dashboard that is both slow and wrong, which is the worst combination — it’s expensive to keep an inaccurate number on screen.
There’s a third, quieter failure: reporting a single win-rate percentage with no sample size attached. “68% win rate” from 25 trades and “68% win rate” from 2,500 trades are not the same claim, but a bare percentage renders them identically — and early in a strategy’s life, when the trade count is smallest, the naive metric provides zero guardrail against overreacting to noise.
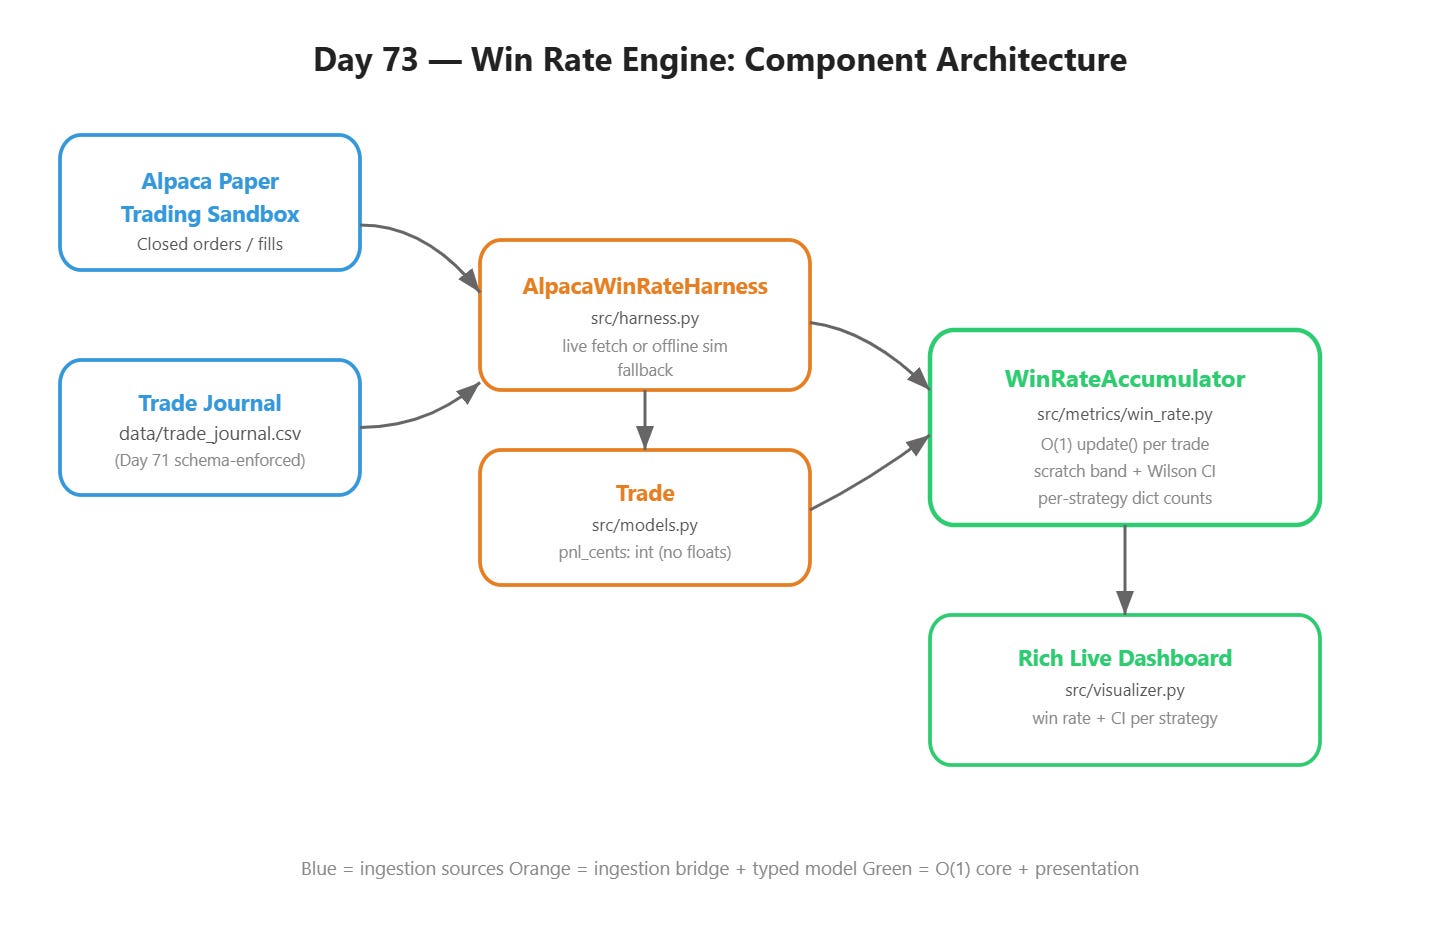
The AutoQuant-Alpha Architecture