Day 74 — Trade Duration: Calculating the Time Between NEW and FILLED

The “Scan the Journal” Trap
Here’s how a junior engineer solves “how long did my order take to fill.” They already have the Day 71 order journal loaded into a DataFrame or a list of dicts. For every FILLED row, they search backward through the list for the matching NEW row with the same order_id, subtract the timestamps, and move on.
def naive_duration(events, fill_event):
    for e in reversed(events):
        if e["order_id"] == fill_event["order_id"] and e["event_type"] == "new":
            return fill_event["timestamp"] - e["timestamp"]
It passes every test on day one. The demo dataset has forty orders. Forty linear scans of a forty-row list is nothing. Then Week 12 arrives, the journal has 300,000 rows from a live trading session, and the dashboard that used to refresh in 40ms now takes 11 seconds to compute a single duration histogram — because for every one of ~50,000 fills, you’re rescanning up to 300,000 prior events looking for a match. That’s O(n·m) behavior dressed up as a “simple lookup,” and it gets worse every single day the strategy runs, because events only grows.
The second failure is quieter and more dangerous: partial fills. A 10,000-share order might arrive as three separate fill events — 3,000 shares, then 4,000, then the remaining 3,000. If your matcher fires a “duration” calculation on the first PARTIALLY_FILLED event instead of waiting for the order to be fully filled, you’ve reported a fill latency of 40ms for an order that actually took 2.3 seconds to fully execute. Every latency metric downstream of that number — your p95 fill-latency alert, your slippage-vs-time correlation, your “is my execution algo degrading” dashboard — is now silently wrong, and it degrades exactly when it matters most: during a volume spike when partial fills become common.
The Failure Mode, Precisely
Two distinct bugs compound here:
Algorithmic complexity. A linear or
.index()-based search for the matchingNEWevent turns what should be a constant-time lookup into a full journal rescan. This is the same class of mistake as recomputing a rolling metric from scratch on every tick instead of maintaining an accumulator — it works at toy scale and falls over at production scale.State ambiguity under partial fills. Treating any
FILLED-family event as terminal, rather than tracking cumulative filled quantity against the order’s total quantity, produces a duration measurement for an order that isn’t actually done.
There’s a third, subtler issue worth naming: clock skew. If your NEW timestamp comes from your local system clock at order-submission time and your FILLED timestamp comes from Alpaca’s server-side event timestamp, you can occasionally observe a fill timestamp that’s earlier than your recorded new timestamp — not because time ran backward, but because the two clocks aren’t perfectly synchronized. A naive subtraction produces a negative duration, which then corrupts any percentile or mean calculation downstream (a negative number dragging your p50 down is a particularly nasty silent bug, since it doesn’t crash — it just quietly lies).
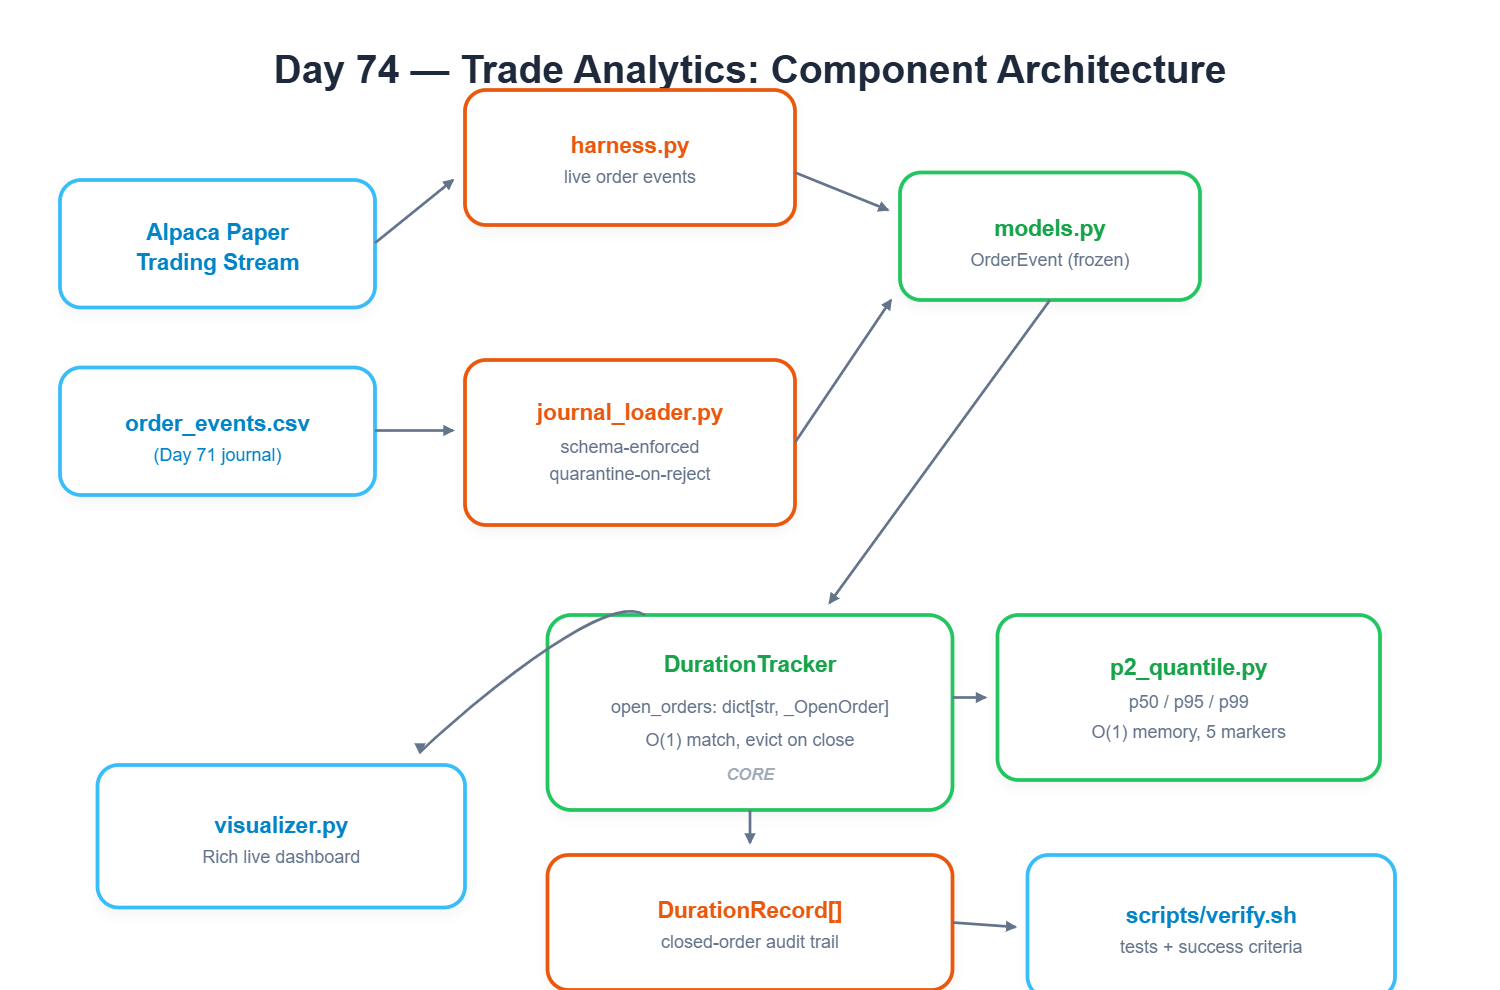
The AutoQuant-Alpha Architecture