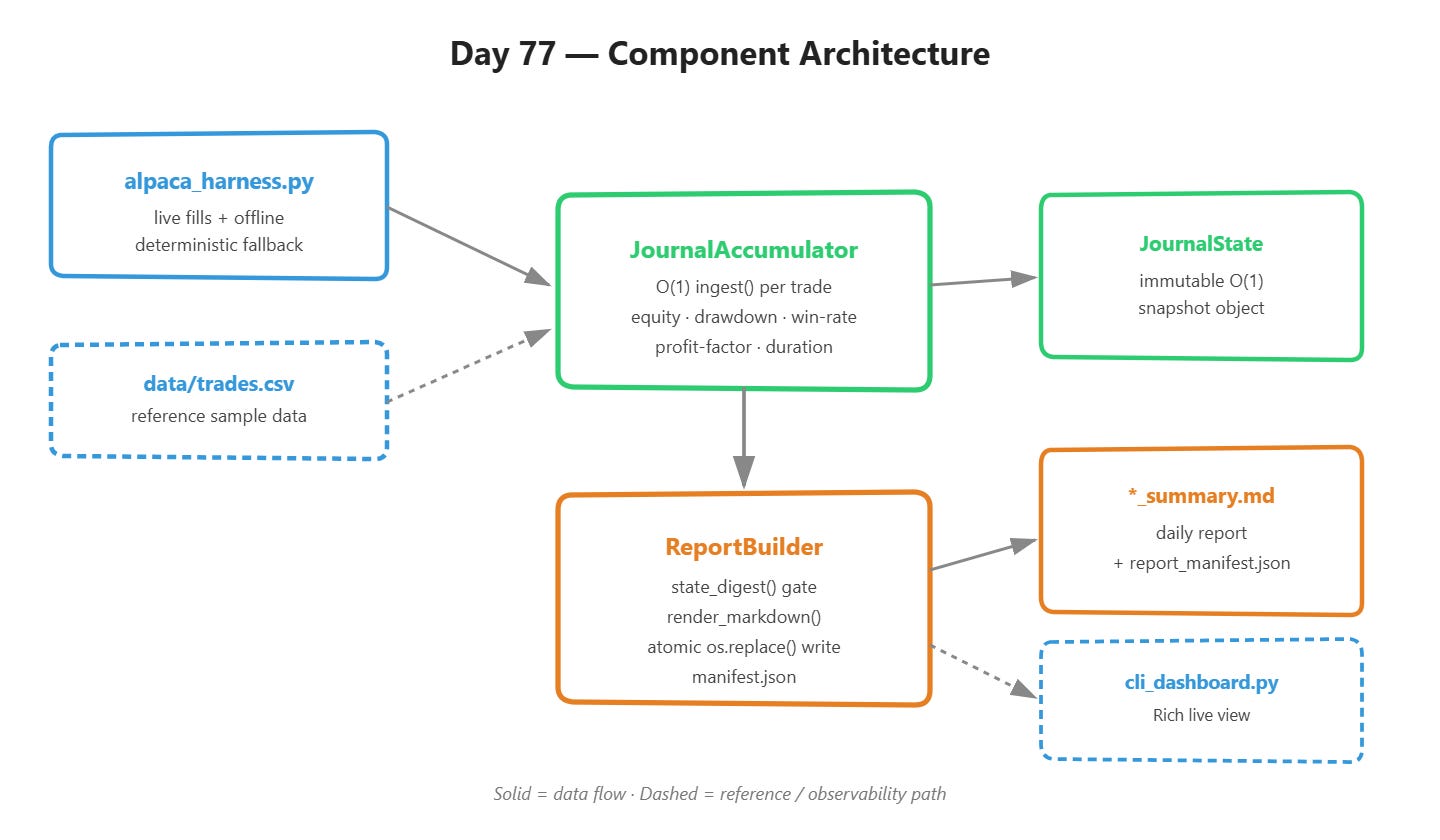
Week 11 is done after today. You’ve built five streaming accumulators — equity curve, drawdown, trade duration, win-rate, profit-factor — each one an O(1) update per fill. Today we wire them into the one thing a human actually reads: the daily Markdown summary. If you get this wrong, it doesn’t matter how elegant your accumulators are, because the artifact that reaches a trader’s Slack channel is corrupted, stale, or missing.
The “Rescan and Render” Trap
Here’s how a junior engineer ships Day 77. There’s a trades.csv on disk and a report that needs to say “here’s today’s win rate.” The obvious move:
def generate_report():
    trades = pd.read_csv("trades.csv")
    equity = trades["pnl"].cumsum()
    win_rate = (trades["pnl"] > 0).mean()
    profit_factor = trades[trades.pnl > 0].pnl.sum() / abs(trades[trades.pnl < 0].pnl.sum())
    report = f"Win rate: {win_rate:.1%}\nProfit factor: {profit_factor:.2f}"
    with open("report.md", "w") as f:
        f.write(report)
This works in a notebook. It fails in production for three independent reasons, and all three show up together, because they all stem from treating “generate the report” as “recompute everything from raw history.”
Reason one: it’s called on every fill, not once a day. A trading desk that wants a live dashboard — not a batch job at 4pm — calls this function from a webhook every time Alpaca posts a fill. On trade #4,000 of the session, pd.read_csv re-parses four thousand rows, cumsum() walks the whole series again, and the two boolean masks for profit factor rescan the full frame. You are paying for the entire day’s history on every single trade. That’s O(n) work per event and O(n²) work across the session — the exact failure Days 71–76 already eliminated at the accumulator level. If your reporting layer bypasses those accumulators and reaches for pd.read_csv again, you’ve reintroduced the O(n²) bug one layer up, and during a volatility spike when fills arrive in bursts, this is precisely when the report generator falls behind and starts queueing.
Reason two: f"{win_rate:.1%}" on a value built from repeated float division and subtraction is not the same number twice. Run this pipeline twice against byte-identical input and you can get 54.999999999999996% one time and 55.00000000000001% the next, depending on the order floating point operations happen to execute in. That’s not a rounding-display problem — it’s a reproducibility problem. If this report feeds a downstream reconciliation job or gets diffed against yesterday’s, you now have false deltas showing up caused by nothing but float arithmetic. Days 71–76 already forced you into integer cents at the parse boundary; a report generator that re-derives percentages from a float .sum() throws that discipline away at the last mile, which is the worst possible place to lose it.
Reason three: open("report.md", "w") is not atomic. If the process gets OOM-killed, the container gets rescheduled, or you Ctrl-C mid-write — and during a burst of fills that’s exactly when memory pressure spikes — the file on disk is truncated. Whatever consumes that report next (a Slack bot, a dashboard, a human tailing the file) reads a .md that ends mid-table. There is no partial-write detection in a Markdown parser; it just renders garbage silently.
The Failure Mode, Concretely
Put reasons one and three together and you get the actual incident shape: report generation gets slower as the session goes on (O(n) per call growing with n), which increases the window during which a crash or restart can land mid-write, which is also the exact moment — a volatility spike driving fill volume — when your infrastructure is most likely to be under memory or CPU pressure and most likely to restart the process. The bug you’d catch in a five-trade test disappears; the bug you’d hit in a five-thousand-trade session is guaranteed.
The AutoQuant-Alpha Architecture