The “Just Sum the Fills” Trap
Every portfolio manager needs to answer three questions for every symbol, at any moment: how many shares do I hold, what did I pay for them, and how much have I made or lost. A junior engineer’s first instinct is to store the raw fill history — a list of (side, qty, price) tuples per symbol — and answer those questions by iterating over the list whenever someone asks.
It looks fine in a REPL with five trades. It looks fine in the demo you show your manager. Then the strategy goes live, starts trading four symbols intraday, and by 2 PM you’ve got 4,000 fills sitting in a dict of lists. Your risk dashboard polls avg cost and unrealized P&L on every quote tick — call it twice a second per symbol during a volatility spike. Each poll now walks the full fill history to recompute a weighted average. That’s O(n) per query, and the query rate is itself proportional to market activity, which means your compute cost grows precisely when you can least afford latency: during the exact volatility spike your risk system exists to catch.
There’s a second, quieter bug hiding in the same naive design, and it’s more dangerous because it doesn’t show up as a performance problem — it shows up as wrong numbers that look plausible. If you compute “average cost” as the arithmetic mean of fill prices instead of the quantity-weighted average, you get silently corrupted cost basis the moment fill sizes vary. Ten shares bought at $100, then a thousand shares bought at $50, do not average to $75. The correct weighted average is close to $50.50 — the thousand-share fill should dominate. An arithmetic mean of prices treats a 10-share odd lot and a 1,000-share block as equally important, which is never true once you’re sizing positions by conviction or executing in tranches. This bug ships quietly: every downstream realized-P&L calculation is now wrong by a consistent, unnoticed amount, and it will not throw an exception. It will just make your book wrong.
The Failure Mode, Precisely
Two independent failures compound here:
Algorithmic complexity. Recomputing cost basis and P&L from full history is O(n) per read. If reads scale with market activity (which they do — that’s the whole point of a live risk dashboard), the system is effectively O(n²) over a trading session. By fill #5,000, a single P&L snapshot does 5,000 units of avoidable work. This is exactly the kind of hidden quadratic blowup that a naive backtest never surfaces (backtests rarely simulate 5,000 fills against a live polling loop) but a production system discovers the hard way, usually during the highest-stakes moment of the day.
Wrong formula. Arithmetic mean of prices instead of quantity-weighted average cost. This isn’t a performance bug — it’s a correctness bug, and it corrupts realized P&L on every partial close from that point forward.
Neither failure requires malicious input or an edge case. Both trigger under completely normal multi-fill, multi-size trading — which is every real trading day.
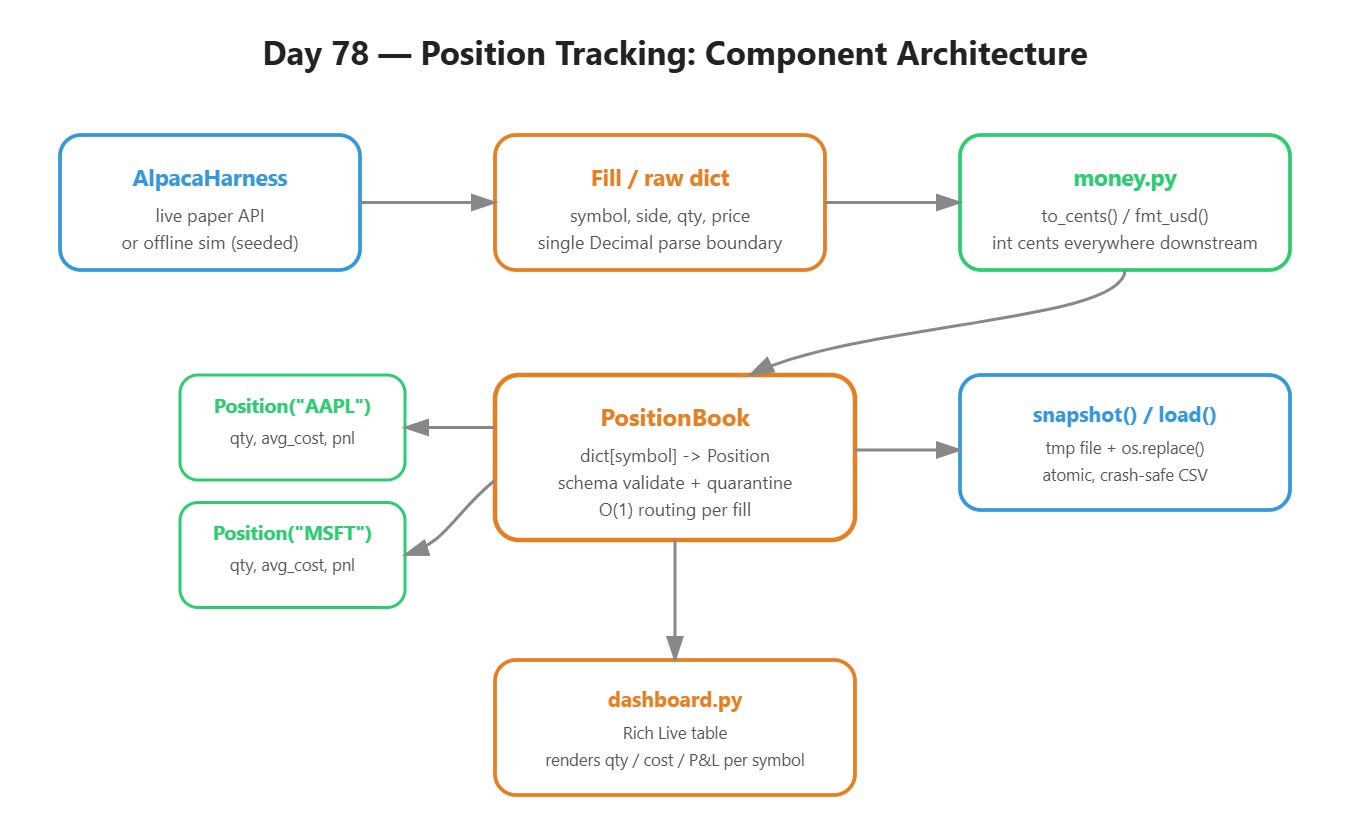
The AutoQuant-Alpha Architecture